
Alluvial Gold Mining Evidence (EVOA) in Colombia (2020–2025): comprehensive analysis and territorial dynamics
·
By
118,410 ha
+25.0% since the 2022 low
75%
88,860 ha without authorization
US$3,431 / oz
+94% versus the 2020 average
78%
18,827 ha of the national increase
The publication of the official EVOA 2025 report, prepared jointly by the United Nations Office on Drugs and Crime (UNODC) and Colombia’s Ministry of Mines and Energy, marks an analytical milestone for understanding the territorial and extractive dynamics in the country.
At Grupo Cascada we have consolidated and analyzed the 2020–2025 reference time series, examining not only the magnitude of the phenomenon at the national, departmental and municipal levels, but also its relationship with the international price of gold, the pace of official mining formalization and comparative behavior in other Amazon basin countries (Brazil, Peru, Ecuador and Bolivia).
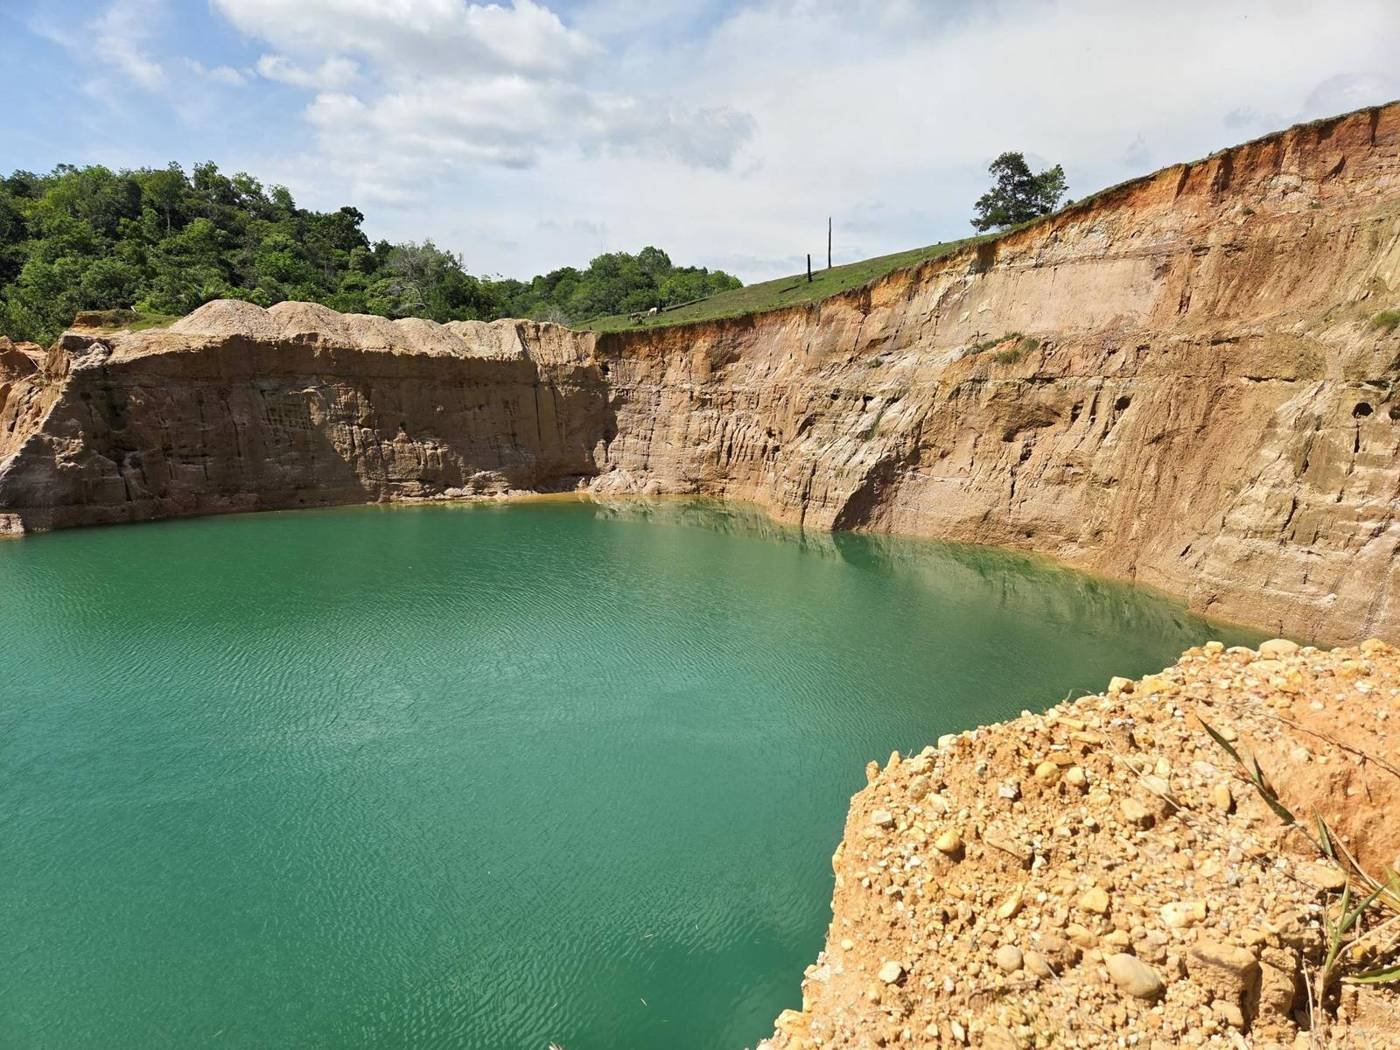
Key reference figure: in 2025 Colombia reached 118,410 hectares with evidence of onshore alluvial gold mining, the highest value recorded since UNODC began satellite monitoring in 2014. 75% of this area operates under illicit or unauthorized conditions.
01 · Has the EVOA area in Colombia increased or decreased?
The area detected with evidence of onshore alluvial gold mining went through two contrasting phases during the six-year period: it fell for two consecutive years (2021 and 2022) and rebounded for three years in a row (2023, 2024 and 2025).
In aggregate terms, the area grew 25.0% between 2022 and 2025 (+23,677 additional ha) and 17.5% compared with 2020.
| Year | Onshore EVOA area (ha) | Year-over-year change | Illicit condition (%) | Average gold price (US$/oz) |
|---|---|---|---|---|
| 2020 | 100,752 ha | +2.8% | 80% | US$1,770 |
| 2021 | 98,567 ha | −2.2% | 78% | US$1,799 |
| 2022 | 94,733 ha | −3.9% (low of the period) | 73% | US$1,800 |
| 2023 | 105,060 ha | +10.9% | 76% | US$1,941 |
| 2024 | 113,310 ha | +7.9% | 72% | US$2,386 |
| 2025 | 118,410 ha | +4.5% (all-time record) | 75% | US$3,431 (all-time high) |
Likewise, the geographic footprint of alluvial mining spread out: the departments with onshore EVOA presence rose from 12 in 2020 to 15 in 2025, while the affected municipalities increased from 98 to 118.
02 · Legality status: the persistence of illegality
One of the most conclusive findings of the reviewed series is that the vast majority of alluvial gold activity lacks legal cover and formal environmental management instruments:
- Illicit or unauthorized mining (2025): 75% of the national total (88,860 hectares).
- With technical and/or environmental permits: 21%.
- On the path to legality: 4%.
Throughout the 2020–2025 period, the illicit share has remained on a structurally high plateau: 80% (2020), 78% (2021), 73% (2022), 76% (2023), 72% (2024) and 75% (2025).
Technical conclusion: three out of every four hectares disturbed with onshore machinery continue to operate outside the formal regulatory framework, without adequate environmental management or mine closure plans.
03 · How does it relate to the international price of gold?
One of the most common hypotheses in public debate assumes that the increase in mined area responds automatically and immediately to fluctuations in the international price. However, the descriptive data reveal essentially divergent dynamics:
- 2020 to 2022: the average gold price stayed relatively flat (US$1,770/oz in 2020 to US$1,800/oz in 2022), and the EVOA area decreased.
- 2023 to 2025: the price accelerated its rise (+7.8% in 2023, +23.0% in 2024 and +43.8% in 2025), reaching a record average of US$3,431/oz in 2025 (+94% versus 2020).
- The slowdown of the EVOA area: while the gold price experienced exponential acceleration, the annual growth rate of the EVOA area gradually slowed (+10.9% in 2023, +7.9% in 2024 and +4.5% in 2025).
Although the correlation between annual levels is high (r = 0.90; n = 6), the correlation between year-over-year changes drops to r = 0.42. This is a descriptive correlation, not an inferential one.
As UNODC notes, no direct mechanical causal relationship has been established. In addition, the report describes a notable productive paradox: despite record international prices, higher exports and an increase in royalty collection, gold production formally reported to the National Mining Agency (ANM) decreased (from 61.3 tonnes in 2023 to 51.1 tonnes in 2025), in parallel with the expansion of the unauthorized area.
04 · And what about progress in mining formalization?
The analysis of mining formalization faces a structural transparency challenge: a lack of homogeneous public information. The ANM does not publish a continuous annual 2020–2025 series of formalization contracts broken down exclusively for gold; official figures use disparate categories and periods.
In the only two-year period with comparable annual data (2024 versus 2025):
- While the EVOA area grew 4.5%, the formalization contracts or resolutions reported by the ANM went from 106 in 2024 to 67 in 2025 (cutoff in November, all minerals).
- Although the mining authority reports more than 22,000 formalized miners cumulatively for 2022–2025, the pace at which formal instruments are issued does not keep up with the speed at which machinery is expanding across the territories.
05 · Territorial overview: concentration, critical hotspots and environmental alerts
The two major epicenters
Chocó and Antioquia concentrate 78% of the national total and account for 18,827 ha of the net national increase since 2022:
- Chocó: 46,958 ha in 2025 (+28.5% versus 2020 and +24.1% versus 2022).
- Antioquia: 45,042 ha in 2025 (+27.5% versus 2022).
- Córdoba: continuous growth year after year since 2021 (+45.8% between 2022 and 2025, reaching 7,489 ha).
Documented reductions
- Bolívar: is the only large department with a smaller area in 2025 than in 2020 (−19.2%, going from 10,583 to 8,546 ha).
- Putumayo: recorded a notable contraction of 41.2% in 2025 (from 782 ha to 460 ha).
- In the 2024→2025 transition, Nariño (−371 ha), Cauca (−352 ha), Valle del Cauca (−37 ha), Guainía (−29 ha) and Caquetá (−8 ha) also showed reductions.
Alarm in protected areas and collective territories
- National Natural Parks: the disturbed area increased 87% in 2025 (from 149 ha in 2024 to 278 ha in 2025). Critical alarm in Amazonas: with no onshore EVOA until 2022, it recorded 7 ha in 2023, 27 ha in 2024 and 177 ha in 2025, all concentrated within the Río Puré National Natural Park.
- Black communities’ lands: concentrated 61% of the net national increase between 2024 and 2025 (3,096 additional ha).
Top 10 municipalities with the largest illicit area in 2025
| Rank | Municipality | Department | Illicit hectares (2025) | National share |
|---|---|---|---|---|
| 01 | Nóvita | Chocó | 6,716 ha | 7.6% |
| 02 | El Cantón del San Pablo | Chocó | 6,375 ha | 7.2% |
| 03 | Ayapel | Córdoba | 6,038 ha | 6.8% |
| 04 | Río Quito | Chocó | 5,881 ha | 6.6% |
| 05 | Istmina | Chocó | 5,258 ha | 5.9% |
| 06 | Cáceres | Antioquia | 5,042 ha | 5.7% |
| 07 | Nechí | Antioquia | 4,128 ha | 4.6% |
| 08 | El Bagre | Antioquia | 3,028 ha | 3.4% |
| 09 | Zaragoza | Antioquia | 2,988 ha | 3.4% |
| 10 | Quibdó | Chocó | 2,632 ha | 3.0% |
These 10 municipalities concentrate 54% of all the illicit area in the country. In fact, 9 of them were already in the historical top 10 between 2020 and 2022, confirming deep territorial inertia.
06 · Regional perspective: comparison with the Amazon basin
When comparing the data with neighboring countries, a methodological clarification is essential: no other country measures an indicator equivalent to EVOA (active area with onshore machinery). Initiatives such as Amazon Mining Watch (AMW) and MAAP measure new annual deforestation caused by mining, while MapBiomas monitors the garimpo footprint.
| Country / region | Monitoring indicator | Recent dynamics (2022–2025) | Behavior |
|---|---|---|---|
| Colombia | Active onshore EVOA area (UNODC/MinEnergía) | From 94,733 ha to 118,410 ha (+25.0%) | Continuous increase |
| Amazon (9 countries) | New mining deforestation (AMW / MAAP) | −45% in 2024 versus the 2022 peak (111,603 ha) | General decline |
| Brazil | Garimpo and new deforestation (MapBiomas/AMW) | Yanomami Indigenous Territory: from ~1,800 ha (2022) to 45 ha (2025) | Significant reduction |
| Peru | New deforestation (AMW / MAAP) | 2024 decline (−46%); rebound in Tambopata (2025) | Rebound in 2025 |
| Ecuador | Hotspots in Napo and the Punino area (MAAP / EcoCiencia) | Sustained rise in monitored active hotspots | Rise in hotspots |
| Bolivia | Gold-mining area affected (AMW / Nómadas) | +13.7% between January and October 2025 | Rise in 2025 |
Unlike Brazil and the Pan-Amazon aggregate, Colombia maintained a sustained upward curve of active EVOA area between 2022 and 2025.
07 · Strategic implications and ESG risk management
The findings of the 2020–2025 monitoring make it clear that unauthorized mining is neither a passing phenomenon nor a passive reflection of international prices. It is a highly complex territorial challenge that demands integrated responses:
- Rigorous due diligence in the supply chain: ensure mineral traceability from the extraction front to export, mitigating the risk of contaminating formal flows.
- Quantitative social license to operate (SLO) models: understand that in territories where 75% of activity operates without permits, formal companies require a meticulous audit of community perceptions and social conflict risks.
- Effective formalization with technical and environmental support: overcome bureaucratic slowness through co-investment schemes and responsible mining models that offer a sustainable economic alternative to illegality.
Documentation and downloadable resources
We make available to the mining-energy sector, investors, academia and decision-makers the source documents prepared by our technical team:
To learn how we advise companies and investors on ESG risks, social license and territorial engagement, write to us at contacto@grupocascada.net.
Main source: EVOA 2025 Report, Ministry of Mines and Energy and UNODC (October 2, 2026).
Ready to take the next step?
Tell us your challenge and let’s design the solution together.